Appearance
Testing Timestral on the CAC 40: what a time series model does when the data is noise
Timestral-209M is a 209M-parameter time series forecasting model released by Mistral AI on Hugging Face. It is a zero-shot quantile forecaster: you give it a raw numerical history, it returns a full distribution of possible futures, no training, no features, no per-series tuning. I have evaluated Google's TimeFM models in the past and found this class of model genuinely interesting for industry and predictive maintenance, where you often have years of sensor history and no time to build a bespoke model per signal. The open question was what happens when the data has no structure at all.
I wanted to test Timestral on unpredictable data. Stocks are the canonical case: 40 names, daily closes, a market that is close to a random walk. The question was whether the model knows it cannot predict stocks, and whether it says so in the shape of its uncertainty.
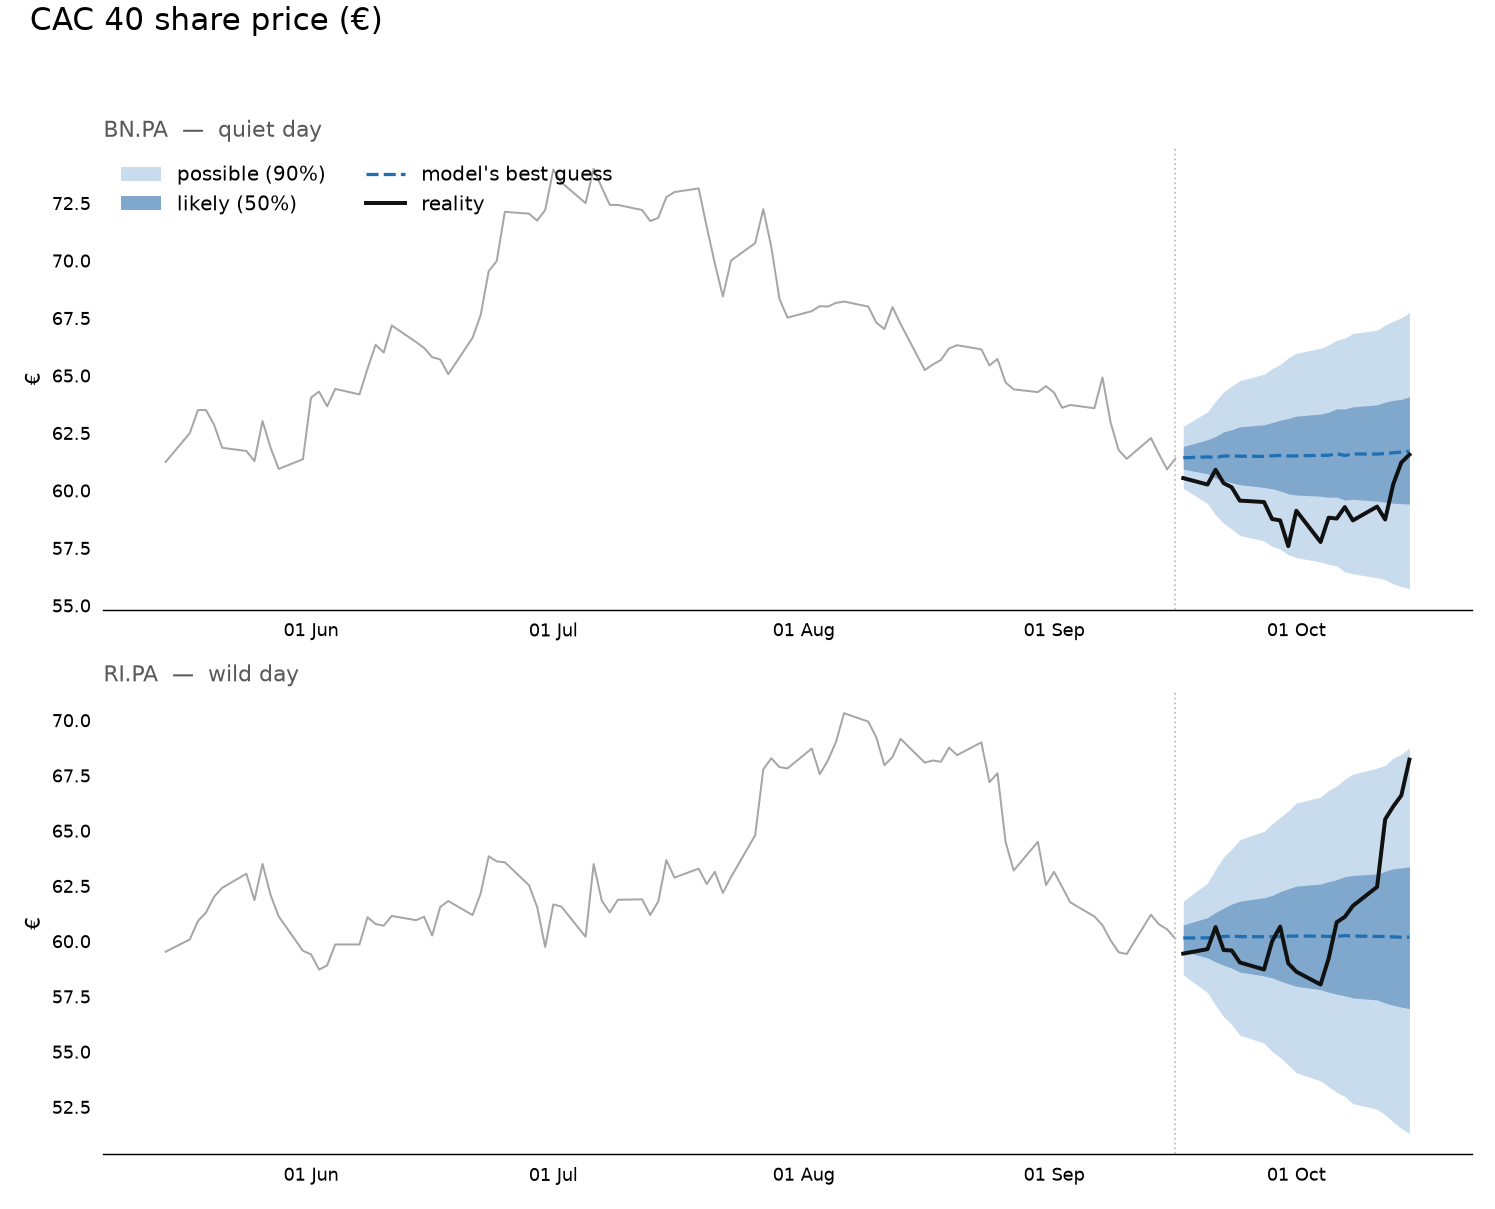
The CAC 40 stocks panel from the walk-forward backtest: grey history, dotted issue line, dark blue dashed median, medium 50% band, pale 90% band, black realized line. The model draws a flat, slightly-fanning envelope for each of the 40 names, which is the correct shape for a near-random walk.
The setup
The model runs locally on my M5 Max MacBook Pro through the timestral Python package, on MPS. Context cap is 32,768 steps, quantile knots from 0.01 to 0.99, and any horizon up to the patch size is a single decode block. I evaluated it across two protocols:
- Walk-forward backtest: every trading day for the last 12 months, the model sees the full history up to that day and forecasts 1 day, 1 week, and 1 month ahead. Scored against persistence (last value) and a 20-day SMA on identical origins.
- Sealed live cast: issue a forecast, write it to disk, wait for the close, score it. The forecast is never revised. This is the protocol that matters for operational use.
For the live cast I issued 40 sealed next-day predictions anchored at Friday 2026-10-16's close, targeting Monday 2026-10-19's close. The anchor is enforced: the fetch function truncates any intraday bar and asserts the last context bar equals the anchor date. After the close, a separate --check mode reads the sealed CSV and scores it against realized values.
Finding 1: the model ties persistence, and that is the correct answer
Across the 12-month walk-forward backtest on all 40 CAC 40 constituents, Timestral scored a pooled WSS of 3.0% against the best classical baseline (persistence with rolling empirical quantiles). That is a tie within the 1-percentage-point tolerance. The model did not beat "tomorrow equals today".
This is the correct result. Professional forecasters agree that one day of a stock is almost unpredictable. A model that drew a wide dramatic curve here would be more wrong than this one is. The flat, slightly-fanning envelope the model produces is itself the model understanding the market.
The comparison against three classical baselines (persistence, ETS with conformal intervals, GARCH) puts the stock result in context. On six structured series (industrial production, savings rate, mortgage rate, electricity price, EUR/USD, temperature), Timestral won every series with WSS improvements of 16% to 37%. Stocks were the only tie. The model earns no medal for predicting noise, and it does not pretend to.
Finding 2: the envelope is honest even when the line is not
The sealed cast for Monday 2026-10-19 was scored on official closes after the 17:35 CEST close. The results:
| Metric | Value |
|---|---|
| In 50% band | 30% (12/40) |
| In 90% band | 78% (31/40) |
| Direction correct | 40% |
| Median absolute error | 1.32% |
Monday was a broad risk-off day: roughly 30 of 40 names were red, many by 2 to 4%. The 50% band was breached more than half the time, but the 90% band caught reality 78% of the time, close to its promise. The 14 escapes were all gap-downs, names that fell 2 to 5% in a single session, beyond what any model calibrated on ordinary days would draw.
The backtest tells the same story at scale: across 12 months of daily forecasts, the 90% band caught reality 86 to 88% of the time, and the 50% band caught it 45 to 48% of the time. The 90% band is about right. The 50% band is consistently too narrow, a known and modest flaw of this 209M model. Treat the pale blue band as the product; treat the medium blue one as decoration.
Finding 3: the sealed protocol prevents the most common cheating
The sealed forecast protocol is simple: anchor, issue, seal, wait, check. The anchor is the last data point the model may see. The issue writes the forecast to disk. The check reads the sealed file and scores it. Nothing gets revised.
I built this because the alternative is worse. Without the protocol, the natural temptation is to re-run the forecast with "better" context after seeing the close, or to adjust the anchor retroactively. The sealed CSV is the single source of truth, and the check is deterministic. When the market gaps beyond the envelope, the miss is recorded, not hidden.
The implementation detail that makes it work is the anchor assertion. The fetch function strips any intraday bar for the current day and asserts that the last context bar equals the anchor date. Information leakage is structurally impossible, not just discouraged.
Finding 4: during the COVID crash, the model widened its envelope without predicting the fall
I ran a dedicated backtest on the CAC 40 index (^FCHI) over a full trading year centered on the March 2020 crash: 2019-09-12 to 2020-09-11, with the crash dead in the middle. Every trading day in that window, the model issued a 1-month-ahead (21 trading days) forecast. Scored by regime segment:
| Segment (by issue date) | n | 90% coverage | 50% coverage | Avg 90% band width | vs persistence |
|---|---|---|---|---|---|
| Pre (targets land in the crash) | 114 | 82.5% | 45% | ~11% of price | +0.3% |
| Crash (Feb 24 to Apr 30) | 47 | 78.7% | 72% | ~46% (4x normal) | -0.4% |
| Recovery (from May 1) | 74 | 100% | 74% | ~25% | +10.4% |
The model never predicted the crash. Pre-crash it kept calm 11%-wide bands, and reality tore through them (82% coverage at its 90% promise). It then reacted by quadrupling its envelope to 46% of price, yet still missed the bottom week. Post-crash it stayed over-cautious: 100% coverage, bands too wide, so wide that plain persistence beat it by 10%.
This is the honest behavior of a pattern model facing a regime it has never seen. The model cannot know that a pandemic is coming. What it can do is widen its envelope when the data gets volatile, and that widening is the usable signal: whoever reads that band prices risk correctly.
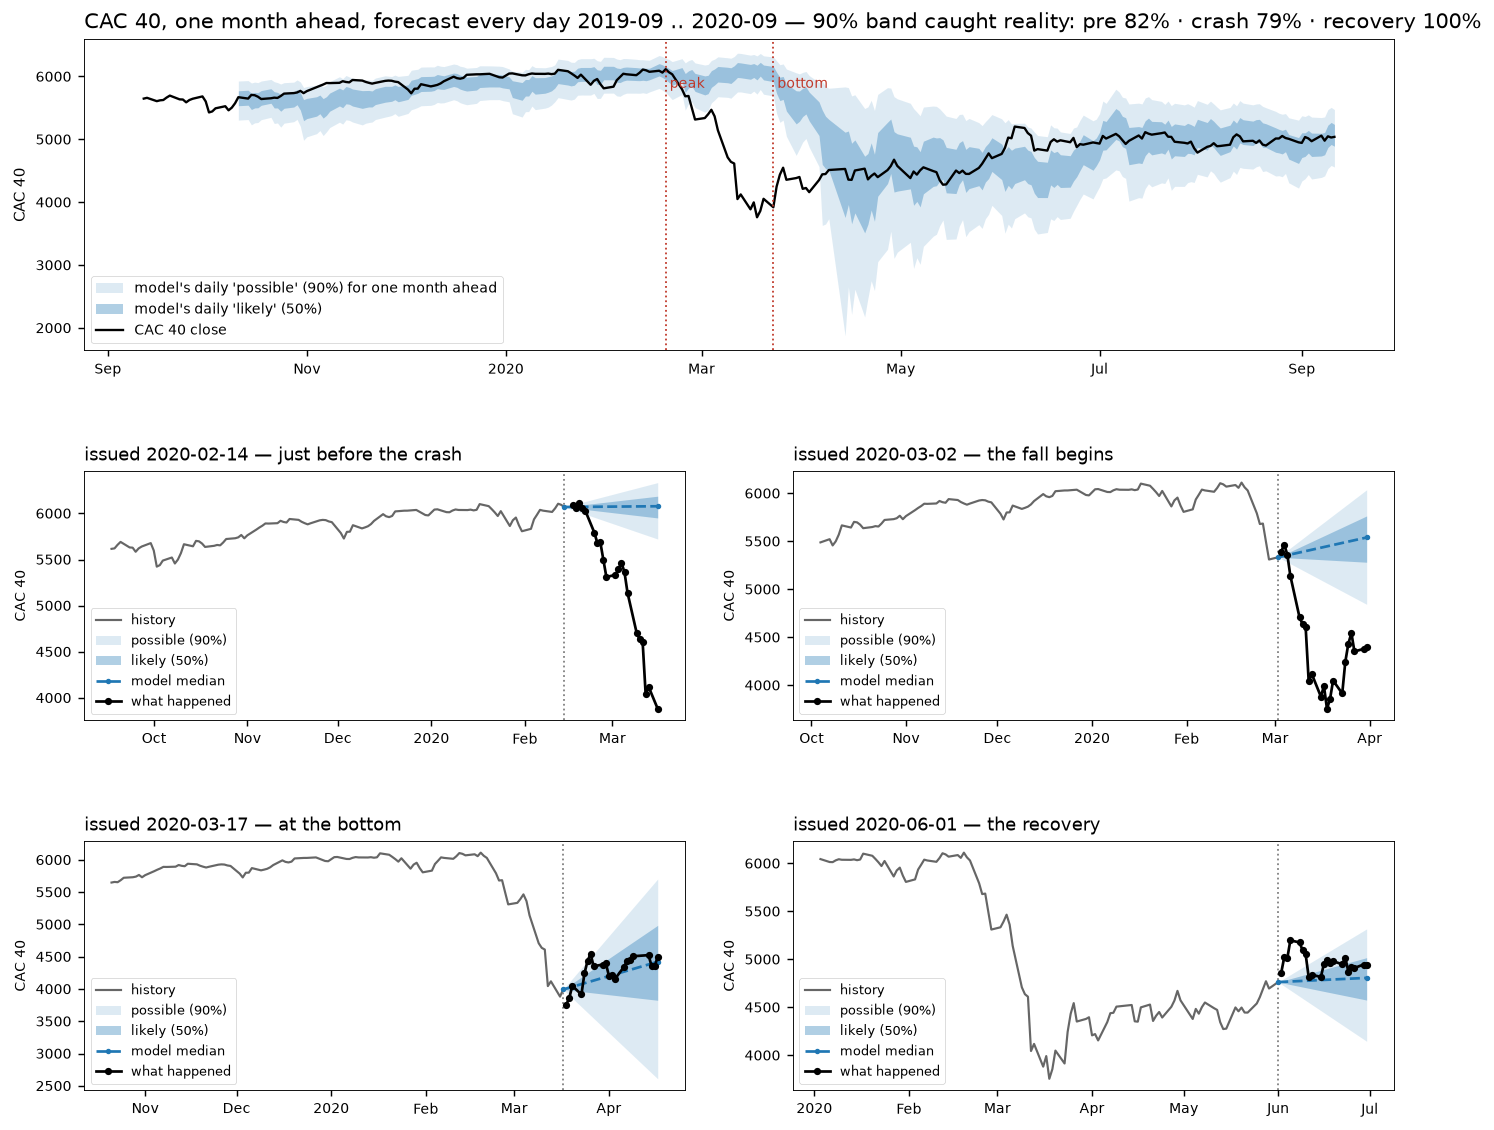
The crash year, one month ahead. Top: the full trading year with the black close line and the blue tubes the model drew every day for "the level one month from now" (pale 90%, medium 50%), plotted at their target dates. Reality escaping the pale tube is a day the model was wrong at its own 90% promise. Bottom: four zoom panels, issued 2020-02-14 (just before), 2020-03-02 (the fall begins), 2020-03-17 (at the bottom), 2020-06-01 (the recovery), each with history, the fan, and what actually happened.
Finding 5: the same model wins where the data has rhythm
The stock result only makes sense next to the structured series. On the same protocol, Timestral beat the best classical baseline by:
- 37% on US industrial production (factory output has momentum)
- 35% on US savings rate (household behavior shifts in shocks)
- 32% on US mortgage rate (slow trends, sudden repricings)
- 29% on French electricity price (jumps of +/-100 EUR/MWh around storms)
- 20% on EUR/USD (the flat fan is the correct answer)
- 16% on Paris temperature (the yearly wave)
Where the data has a rhythm, the model beats any moving average. Where the data has no rhythm, it honestly admits it by fanning wide, and the useful output becomes the width, not the line.
Key takeaways
- A zero-shot time series model can be evaluated on unpredictable data. The right question is whether it knows it cannot predict, and whether it says so in the shape of its uncertainty.
- On CAC 40 stocks, Timestral ties persistence (WSS 3%), which is the correct answer for a near-random walk. The model draws a flat, slightly-fanning envelope, and that shape is itself understanding.
- The 90% envelope is honest: 86 to 88% coverage over 12 months of daily forecasts, 78% on a broad risk-off day. The 50% band is too narrow (~45%); treat the wide band as the product.
- The sealed forecast protocol (anchor, issue, seal, check) makes information leakage structurally impossible and creates a reproducible track record.
- During the COVID crash, the model widened its envelope 4x but did not predict the crash. Regime-reactive widening is the usable signal.
- The same model wins 16 to 37% on structured series (production, rates, temperature, power prices). The contrast between tie-on-stocks and win-on-structure is the practical lesson.
In summary: Timestral on stocks is a tie against persistence and an honest envelope. That combination is the model telling you the truth about the data. For industry and predictive maintenance, where the signals usually have structure, the same model wins by wide margins. The stress test on noise confirms the model knows the difference.
FAQ
Why test on stocks if you know they are unpredictable?
Because unpredictable data is the control group. If a model claims to beat persistence on a random walk, it is overfitting or leaking information. A model that ties persistence while maintaining honest coverage has passed the most important test: it knows what it does not know.
What is the sealed forecast protocol?
Anchor (define the last data point the model may see), issue (write the forecast to disk), wait (the target period elapses), check (score against realized values). The sealed CSV is never modified after writing. The --check mode only reads it. This prevents retroactive "improvement" and makes the track record reproducible.
Why did the 50% band miss its promise?
The model is slightly overconfident in its middle band. Across all series, the 50% band caught reality about 45% of the time instead of 50%. This is a known and modest flaw of the 209M variant. The 90% band is well-calibrated. Use the wide band.
Did the model predict the COVID crash?
No. Pre-crash it kept normal-width bands and reality escaped them. During the crash it widened its envelope 4x but still missed the worst week. The value is in widening the envelope when volatility spikes, which is the signal a risk manager can act on.
How does Timestral compare to Google TimeFM?
I evaluated TimeFM models previously and found the same class of behavior: zero-shot quantile forecasts that are honest about uncertainty. Timestral is Mistral AI's entry in this space. The evaluation protocol (walk-forward, sealed casts, WSS against classical baselines) is the same, which makes the comparison fair.
What is WSS?
Winkler Score Skill. The Winkler score measures interval forecast quality: a band that is too wide is punished, a band that is too narrow is punished harder. WSS compares the model's score against the best classical baseline. Positive means the model's envelope is better, near zero is a tie, negative means it loses.